Free Trees & Forestry tool
 Free Trees & Forestry tool
Tree Carbon Sequestration Calculator
The Tree Carbon Sequestration Calculator determines total lifetime carbon storage and annual CO2 sequestration in pounds from tree species, diameter (DBH), and height. Every tree is a slow bank account of atmospheric carbon, and the honest way to size it is with a published allometry rather than a round number from a poster. Enter diameter, height, and wood density for the Chave equation, or just diameter for the Jenkins hardwood tables, and the tool returns biomass, the carbon and CO₂ it represents, and the annual drawdown implied by your tree's growth rate.
Tree Carbon Sequestration Calculator: result
At a glance
- What it does: Runs the Chave or Jenkins allometry for aboveground biomass, then carbon, CO₂ and annual sequestration.
- Who it is for: For students, landowners and sustainability teams wanting a published equation rather than a poster figure.
- Typical result: Returns kilograms of biomass, carbon and CO₂ plus the yearly drawdown implied by diameter growth.
How to use the tree carbon sequestration calculator
- Measure DBH in centimetres (diameter tape at 4.5 ft, outside bark): the one input both methods require. prefill →
- For the Chave equation, add total height in metres (the tree-height calculator does this) and the species' oven-dry wood density; for a quick screen, switch to the Jenkins DBH-only hardwood tables and pick the closest species group. prefill →
- Enter the annual DBH increment from a growth plot or recent core if you want the sequestration rate; set it to 0 for a stock-only answer.
- Read biomass first, then carbon (× 0.47) and CO₂ (× 3.67). Quote which of the three you are reporting, because carbon and CO₂ figures are routinely confused.
- Treat the ±20–35 % band as part of the answer: report a rounded figure with the method named (Chave 2014, aboveground) rather than a false-precision kilogram.
Tree Carbon Sequestration: the formula & its source
The primary allometry is the pantropic equation of Chave et al. (2014), Eq. 4 (diameter, height, and wood density combined in one scaling term):
AGB = 0.0673 × (ρ × D² × H)0.976 (D in cm, H in m, ρ in g/cm³, AGB in kg)
The DBH-only alternative fits species-group regressions (Jenkins et al. 2003):
AGB = exp(β₀ + β₁ × ln D)
Mass becomes carbon, carbon becomes CO₂:
carbon = AGB × 0.47 · CO₂ = carbon × 44 ÷ 12 = carbon × 3.67
The annual rate re-runs the allometry one increment up the diameter scale:
annual CO₂ = [AGB(D + ΔD) − AGB(D)] × 0.47 × 3.67
| Symbol | Meaning | Unit | Typical range |
|---|---|---|---|
D | diameter at breast height | cm | 0.5–200 cm |
H | total tree height, Chave route only | m | 1–60 m |
ρ | oven-dry wood density of the species | g/cm³ | 0.1–1.2 |
AGB | aboveground dry biomass | kg | 0.1–20,000 kg |
ΔD | annual diameter increment | cm/yr | 0–3, zero skips the rate |
C / CO₂ | carbon stock and its CO₂ equivalent | kg | AGB × 0.47, then × 3.67 |
Tree Carbon Sequestration: worked example
Worked example: 30 cm DBH, 20 m tall, wood density 0.60 g/cm³, growing 0.6 cm/yr. ρD²H = 0.60 × 900 × 20 = 10,800; 10,8000.976 = 8,642; AGB = 0.0673 × 8,642 = 581.6 kg. Carbon = 581.6 × 0.47 = 273.4 kg C; CO₂ = 273.4 × 3.67 = 1,003 kg (1.00 t) CO₂. Next year at 30.6 cm the same equation gives 604.5 kg: a 22.9 kg biomass gain, i.e. 39.5 kg CO₂ sequestered per year. The Jenkins cross-check on the same 30 cm trunk (mixed hardwood, β₀ = −2.48, β₁ = 2.4835) gives exp(−2.48 + 2.4835 × ln 30) ≈ 390 kg: a reminder that equations built on different continents and tree populations disagree by more than a third, which is exactly what the uncertainty row is for.
Example B: Jenkins cross-check
Example B: Jenkins route, no height needed. Keep the 30 cm diameter, switch the equation to Jenkins and pick mixed hardwood: exp(−2.48 + 2.4835 × ln 30) returns about 390 kg of biomass against Chave's 581.6 kg on the same trunk. Carbon follows at 183 kg and CO₂ at 673 kg, some 33 % below the pantropic figure. Neither equation is wrong (they were fitted to different tree populations), so quote the method with the number and treat the spread between them as part of the honest uncertainty rather than as a mistake to eliminate.
Field method
Diameter is the one input every route demands, so take DBH in centimetres at 4.5 ft with the tape outside bark. The Chave route then wants total height in metres (the height page produces it), and the species' oven-dry wood density looked up in a published table. Short of time, the Jenkins route drops both and fits a species group to diameter alone. Add an annual diameter increment from a growth plot or a recent core when the rate matters, or leave it at zero for a standing stock only. Whichever path runs, report the equation alongside the number.
Stock today, rate tomorrow
Three outputs answer three separate questions. Biomass records how much wood has been built, carbon records how much of the atmosphere that wood came from, and the annual row says how fast the account is growing right now. The two mass figures are not interchangeable: 273 kg of carbon becomes a tonne of CO₂ only after the 3.67 multiplier, and mislabelling them understates a climate claim by nearly three quarters. The rate also puts planting arguments in proportion: at roughly 40 kg of CO₂ a year, one mid-sized hardwood is a slow counter, worth planting for the compounding decades and the canopy benefits rather than for an offset this year.Name the equation, the diameter and the year whenever the figure is published, so a later reader can rebuild it from the inputs rather than the rounded total.
Instrument error
Allometries describe populations, not your tree. Chave's pantropic equation pools plots from across tropical forests, while Jenkins was fitted to eastern United States hardwoods and softwoods, so neither carries any knowledge of the site it is being applied to, and single-tree error of ±20–35 % is ordinary rather than exceptional. Wood density is the quiet lever: a fifth of error there flows through biomass nearly proportionally, which is why a species lookup beats a remembered 0.60. The rate row also holds height and density still while diameter creeps up, so it understates the surge of a fast-height-growth youngster.Density tables themselves carry spread: published values for one species vary with provenance and moisture condition, so record which table the number came from.
Common blunders
Reporting carbon where CO₂ was meant, or the reverse, is the most frequent error to leave this page, and the factor between them is 3.67. Feeding inches where centimetres belong collapses the answer because diameter is squared inside the exponent. Treating aboveground wood as the whole tree quietly omits roots, foliage, soil and dead wood the moment the figure becomes an ecosystem claim. Carrying a per-tree rate to a whole stand without multiplying by stems per area repeats the omission at scale, and printing a false-precision kilogram hides a band wider than the digits shown.
Worked field example
A 30 cm stem, 20 m tall, density 0.60: ρD²H = 0.60 × 900 × 20 = 10,800, raised to the 0.976 power gives 8,642, and 0.0673 × 8,642 = 581.6 kg of biomass. Carbon is 581.6 × 0.47 = 273.4 kg and CO₂ is 273.4 × 3.67 = 1,003 kg. At 30.6 cm a year later the same equation returns 604.5 kg, a 22.9 kg gain, which is 39.5 kg of CO₂ for the year. The Jenkins cross-check on that trunk lands near 390 kg, where equations fitted on different continents disagree by more than a third, and the uncertainty band exists precisely for that.
Unit systems
Everything downstream of the equation is metric: centimetres of diameter, metres of height, grams per cubic centimetre of density, kilograms of biomass. Carbon and CO₂ follow as kilogram multiples of that mass, and tonnes arrive by dividing kilograms by 1,000. Imperial crews convert at entry (inches divided by 2.54 for DBH, feet times 0.3048 for height), because both coefficient sets were calibrated to the metric form and neither offers an imperial branch. Quoting a standing stock in tonnes against an annual rate in kilograms is perfectly sound, provided the two rows are labelled distinctly so no reader merges them.
What your tree carbon sequestration result means
Three numbers, three different questions: biomass says how much wood has been built, carbon says how much of the atmosphere it came from, and the annual row says how fast the account is growing right now. Carbon and CO₂ are not interchangeable: 273 kg of carbon becomes a tonne of CO₂ only after the 3.67 multiplier, and swapping the two labels understates climate claims by nearly three-quarters.
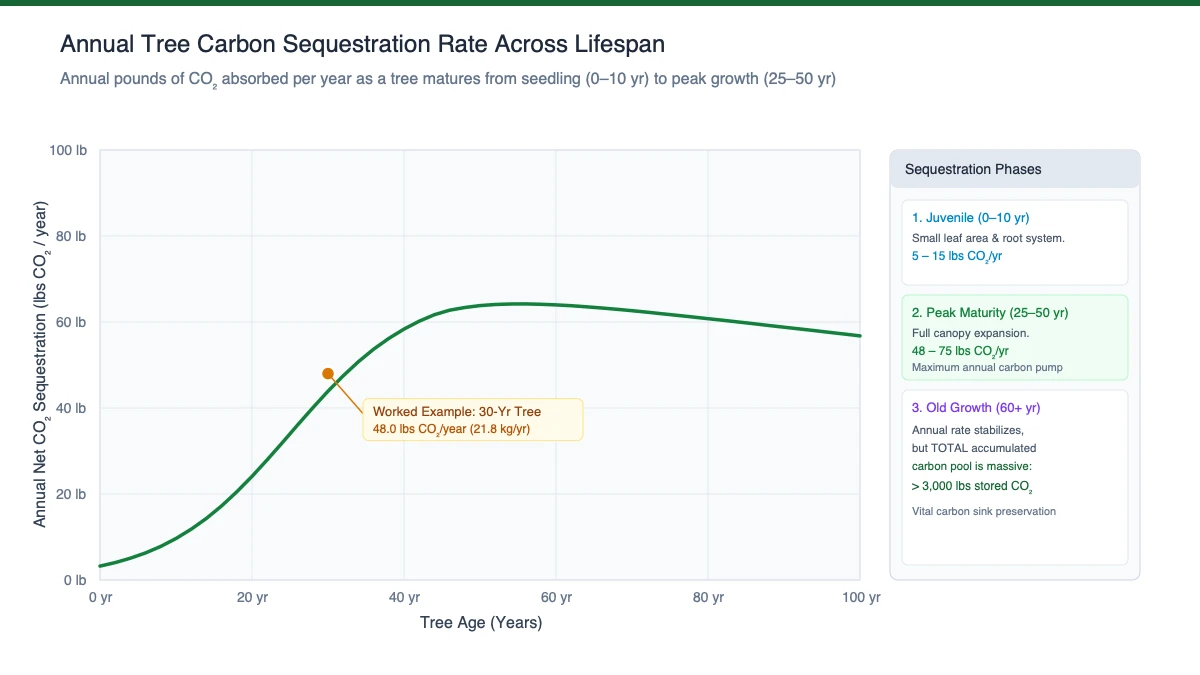
The rate row also reframes planting arguments: at roughly 40 kg CO₂ a year, a single mid-sized hardwood is a slow counter, worth planting for the compounding decades ahead and for the canopy co-benefits, not for an immediate offset claim.
How to read the output:| Result range | What it means | What to do next |
|---|---|---|
| 581.6 kg biomass | aboveground dry mass from Chave | Quote it with the equation named |
| 273.4 kg carbon | biomass times 0.47 | The row carbon inventories report |
| 1.00 t CO₂ | carbon times 3.67 | The row climate pledges quote |
| 39.5 kg CO₂ a year | gain from 0.6 cm of diameter growth | Rate rows follow measured increment |
| ±20–35 % band | published accuracy of the equations | Round the figure and name the method |
| Jenkins near 390 kg | DBH-only route on the same trunk | Method choice moves the answer by a third |
Offset your household carbon emissions by measuring your annual footprint on our individual ecological footprint calculator.
Common mistakes with the tree carbon sequestration
- Labelling carbon and CO₂ with the same word: State which one you mean: carbon × 3.67 gives CO₂, and mixing them shifts a climate claim by nearly three quarters.
- Feeding inches into the diameter field: Both equations expect centimetres with diameter squared inside the exponent, so divide by 2.54 before entry or the mass collapses.
- Reading aboveground wood as total ecosystem carbon: Roots, foliage, soil and dead wood sit outside these equations, so say aboveground whenever the figure travels.
- Guessing a round wood density: Look the species up, since density enters the scaling term directly and a fifth of error there carries biomass with it.
- Extending one tree's rate to a stand without saying so: Multiply by stems per area first, then report the equation and the band so the precision matches the science behind it.
Limits of the tree carbon sequestration calculator
Allometries are population statements. Chave's pantropic equation pools plots across tropical forests; Jenkins was fit to eastern US hardwoods and softwoods. neither is calibrated to your site, and single-tree error of ±20–35 % is normal, not failure. Wood density is the quiet lever: get it wrong by 20 % and biomass follows roughly proportionally, so look the species up rather than guessing 0.60.
This is aboveground wood only: no roots, no foliage, no soil, no dead wood; whole-ecosystem carbon claims need those pools added. The annual row freezes height and density while diameter grows, so it understates fast-height-growth youth and overstates nothing for slow adults. And stored carbon is not sequestered carbon forever: fire, windthrow, harvest, and decay return it, so permanence claims need a time horizon attached.
Forestry note from Dr. Dinesh A. Nagegowda, PhD: Calculating carbon sequestered in a standing tree requires navigating allometric biomass equations. Total fresh green weight must first be converted to dry biomass (averaging 50% for hardwoods and 45% for softwoods). Because carbon constitutes roughly 50% of oven-dry wood, multiplying dry biomass by 0.50 yields elemental carbon, which is then multiplied by 3.67 (the molecular ratio of CO2 to C) to calculate total sequestered carbon dioxide equivalent.
Sources
- Chave, J. et al. 2014, Global Change Biology: improved pantropic biomass model (used for: the DBH, height and density equation used for the primary route)
- Jenkins, J.C. et al. 2003, Forest Science 49(1): national biomass estimators (used for: DBH-only hardwood equations, group coefficients and the 20–35 % band)
- 2006 IPCC Guidelines for National Greenhouse Gas Inventories, Vol. 4 Ch. 4 (used for: the 0.47 carbon fraction and the 44/12 conversion to CO₂)
Cite This Calculator
For laboratory course reports, academic papers, or institutional protocols (APA format):
Tree Carbon Sequestration: frequently asked questions
How much CO₂ does one tree store?
Size-dependent, not species-slogan-dependent: the worked example (30 cm DBH, 20 m, 0.6 g/cm³) gives about 273 kg of carbon, or 1.00 t of CO₂ aboveground. Small street trees hold tens of kilograms; multi-metre heritage oaks hold tonnes.
How much does a tree sequester per year?
Whatever its allometry says it gains: 0.6 cm of DBH growth on the example tree yields about 39.5 kg CO₂ a year. Growth rate varies with site, water, and age. Measure increment rather than adopting a per-tree average.
What is wood density and why does it matter?
Oven-dry mass per unit green volume (g/cm³), a species trait used to convert volume to mass. It enters the Chave equation directly; pines run near 0.35–0.55, many oaks 0.60–0.75: the lookup decides whether the tree weighs half a tonne or a third of one.
Carbon vs CO₂, which should I report?
Both, labeled. Carbon × 3.67 = CO₂. Climate commitments and offsets are quoted in CO₂ (or CO₂e); carbon accounting inventories and scientific papers often quote tonnes of carbon. Mixing the two silently understates or overstates by a factor of 3.67.
Found a number that does not match its source? Report a mistake. Corrections are published in place and the page date is updated.
Something on this page not matching its cited source? Report it.

Dr. Dinesh A. Nagegowda, PhD: Plant & Molecular Biology Editor
Dinesh is a plant molecular biologist and Chief Scientist at CSIR-CIMAP whose research runs through functional genomics, transcriptomics, metabolomics, and biosynthetic pathways in plants. He writes and…