Free Trees & Forestry tool
 Free Trees & Forestry tool
Tree Canopy Cover Calculator
The Tree Canopy Cover Calculator calculates tree crown ground surface area and percentage canopy cover from average crown spread diameter measurements. Canopy cover is the number cities count when they promise shade, cooling, and stormwater relief (and the number ecologists use to call a patch forest or not). Measure crown spreads on your plot and this calculator reports the raw sum, then corrects it for crowns stacking over one another, so the percentage reflects ground that actually sees sky.
Tree Canopy Cover Calculator: result
At a glance
- What it does: Sums crown footprints on a plot into gross cover, corrects for overlap, and reports the open gap fraction.
- Who it is for: For arborists, planners, students and ecologists tracking shade, stormwater or a woodland threshold.
- Typical result: Returns the share of ground under canopy beside the raw crown sum that inventories traditionally quote.
How to use the tree canopy cover calculator
- Measure crown spread (the width of the drip line) in two perpendicular directions, ideally from directly under the crown edge; use the mean for circular mode, or keep both for the ellipse. prefill →
- Count the trees whose crowns you measured in the plot; for a mixed stand, use the average spread and note that a few large crowns will dominate the total. prefill →
- Enter the plot area in acres or hectares: the ground your tree count represents (a 1/10-acre plot is 0.1 here).
- Read gross cover as your raw sum, then the overlap-corrected figure as the share of ground with single unobstructed sky: the number most canopy studies quote.
- Compare against your target: the FAO forest line sits at 10 % gross cover, while urban shade programs are typically judged on corrected cover over whole neighbourhoods.
Tree Canopy Cover: the formula & its source
Crown footprint from spread, for a circular or elliptical crown:
Acrown = π × (spread ÷ 2)² (circle)
Acrown = π × (axis₁ ÷ 2) × (axis₂ ÷ 2) (ellipse)
Sum across trees and divide by the plot, the raw stack:
gross cover (%) = Σ Acrown ÷ plot area × 100
Overlapping crowns must not be counted twice. Treating crown placement as a Poisson process gives the standard correction (the same Beer–Lambert form used for light through a canopy):
corrected cover (%) = 100 × (1 − e−ΣAcrown ÷ plot)
gap fraction (%) = 100 − corrected cover
| Symbol | Meaning | Unit | Typical range |
|---|---|---|---|
spread | crown width along the drip line | ft | 0.5–100 ft |
axis2 | second spread at 90° for elliptical crowns | ft | 0.5–100 ft (circular mode ignores it) |
A_crown | footprint of a single crown | ft² | 0.2–8,000 |
n | trees whose crowns were measured | count | 1–500 |
plot | ground area the tally represents | ac or ha | 0.001–100 |
cover | share of ground lying under canopy | % | 0–100 |
Tree Canopy Cover: worked example
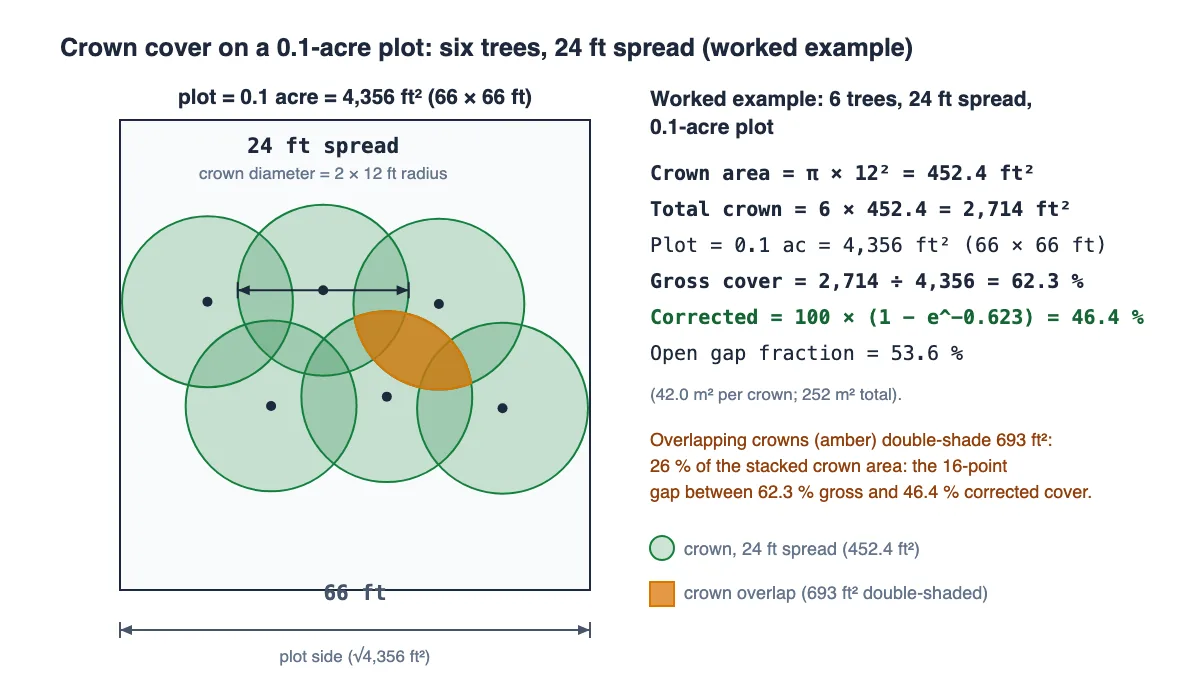
Worked example: six trees, 24 ft spread, 0.1-acre plot. Crown area = π × 12² = 452.4 ft² per tree (42.0 m²). Total = 6 × 452.4 = 2,714 ft² (252 m²). Plot = 0.1 × 43,560 = 4,356 ft². Gross cover = 2,714 ÷ 4,356 × 100 = 62.3 %. Correction: 100 × (1 − e−0.623) = 100 × (1 − 0.536) = 46.4 %, leaving an open gap fraction of 53.6 %. The 16-point spread between the rows is what overlap does: about a quarter of the stacked footprint lies over ground already shaded by another crown.
Example B: one crown, small plot
Example B: one large crown on a tiny plot. A single 30 ft spread on a 1/20-acre plot gives π × 15² = 706.9 ft² against 2,178 ft² of ground: 32.5 % gross, and 1 − e^−0.325 puts corrected cover at 27.8 %. That is nearly a third of the plot shaded by one tree, so a change of one crown either way swings the figure by thirty points. Plots this small are fine for a classroom exercise and useless for a canopy target: widen the ground or add trees before treating any percentage as a property-wide estimate.
Field method
Find the drip line (the outer edge of the shadow the crown casts) and measure its width across in two perpendicular directions, preferably from directly beneath the edge where foreshortening cannot cheat the tape. One reading feeds the circular model; a pair feeds the ellipse and suits the lopsided crowns that grow toward the nearest gap. Count the trees you measured and enter the ground they stood on, a tenth-acre plot as 0.1 or its 0.04 ha equivalent. The tool sums footprints, divides by the plot, then collapses stacked layers to the share of ground with open sky.
Two cover numbers, two jobs
Gross cover is the raw stack with every crown counted once, overlaps and all. It answers footprint questions and feeds the forest definition, which counts ground at ten percent crown cover or more. Corrected cover strips the double counting down to the share of ground seeing open sky, and that is the figure shade, microclimate and light studies need. Reporting one where the other belongs is how canopy targets drift: a 62 % gross canopy can leave more than half the ground in full sun, so a cooling programme that quotes the gross row promises shade the block never delivers. The gap fraction is simply the other side of the corrected figure.Name which row you used in any report, because two canopy figures for one plot are otherwise impossible to compare with anything on paper.
Instrument error
Spread is read off a moving, irregular object. Wind, drooping leaders and a crown leaning toward a gap all skew one reading, and a lone open-grown tree spreads far wider than the same genotype packed inside a stand. The correction itself assumes random placement: an evenly spaced planting overlaps less than random, so its true cover sits nearer the gross row, while a clumpy natural stand sits nearer the corrected one. Small plots generate the loudest noise: a single 30 ft crown on a twentieth of an acre moves the percentage by around thirty points, which is measurement geometry rather than anything the trees did.Ground paced with a wheel beats a guessed plot outline, because the denominator carries the same error as every crown sum divided by it.
Common blunders
Measuring from a distance instead of standing under the drip line foreshortens every spread and shrinks the total with it. Reading an acre plot as a hectare inflates the denominator two and a half times over and cuts the reported cover to roughly 40 % of the truth. Averaging spreads before summing discards the big crowns that dominate the total, exactly as a mean diameter does for basal area. And treating cover as canopy condition puts a health claim on an area measurement: sixty percent cover of dead-topped elms shades and transpires nothing like sixty percent of healthy oak.Percentages from one small plot rarely represent an entire property, so take at least two plots in different parts of the block before quoting a block-wide figure.
Worked field example
Six trees at 24 ft spread on a 0.1-acre plot: each crown holds π × 12² = 452.4 ft², the six together 2,714 ft² against 4,356 ft² of ground, so gross cover reads 62.3 %. The overlap correction gives 100 × (1 − e^−0.623) = 46.4 %, leaving a gap fraction of 53.6 %. The sixteen-point spread between those rows is overlap (about a quarter of the stacked footprint sits over ground a second crown already shades), and at 53.6 % gaps more than half the plot still takes direct sun.
Unit systems
Spreads arrive in feet, so footprints come out in square feet: π × 12² reads 452.4 ft², or 42.0 m² once 0.092903 is applied. Ground area is the part that switches: acres for an American inventory, hectares for metric work, with 0.1 acre and 0.0405 ha describing the same patch of ground. Both routes end in a percentage, which carries no unit at all, and the ten-percent forest threshold and urban shade targets are quoted the same way. State the plot unit only when someone asks how the sum was taken; the cover figure itself travels between systems untouched.
What your tree canopy cover result means
Cover is the interface between canopy and everything beneath it: how much rain is intercepted before it hits pavement, how much sidewalk stays shaded at noon, how much recruitment light reaches seedlings. Reporting both rows keeps two traditions apart: forestry inventories and the FAO forest definition work from crown-sum (gross) figures, while light, microclimate, and urban-heat studies need the corrected share of ground with open sky.
The gap fraction is the inverse view of the same number: at 53.6 % gaps, more than half the plot still receives direct sun: the reason a 62 %-gross canopy cools far less than its headline suggests.
How to read the output:| Result range | What it means | What to do next |
|---|---|---|
| 62.3 % gross | raw sum of crown footprints | Footprint questions and forest definitions |
| 46.4 % corrected | stacked crowns collapsed to one layer | Shade, light and microclimate work |
| 53.6 % gap fraction | ground still seeing open sky | Seedling light and heat exposure |
| Below 10 % | under the forest threshold | Woodland criteria not yet satisfied |
| One crown swings it | very small plot, few trees | Widen the ground before quoting a figure |
| Cover near gross | evenly spaced planting | Regular grids overlap less than random |
Correlate mature canopy coverage with atmospheric carbon storage on our urban forest carbon sequestration tool.
Common mistakes with the tree canopy cover
- Measuring the spread from a distance: Walk to the drip line and measure across the shadow edge, since a foreshortened read shrinks every footprint and the total with it.
- Reading an acre plot as a hectare: The denominator then runs 2.5 times too large and cover falls to about 40 % of its true value; check the plot unit selector.
- Averaging spreads before summing crowns: Sum each crown first: large crowns dominate through the square of their spread, just as big stems dominate basal area.
- Quoting gross cover as a shade promise: Gross counts stacked ground twice, so reach for the corrected row whenever the claim concerns sky, shade or cooling.
- Reporting cover as canopy health: Cover measures area only: a dead-topped canopy covers the same ground while shading and transpiring almost nothing.
Limits of the tree canopy cover calculator
Spread is measured on an irregular, moving object: wind, drooping leaders, and one-sided crowns facing gaps all skew a single reading. Take perpendicular measures, still mornings, and note that a lone tree in the open spreads far wider than the same genotype in a stand. Multi-stemmed and clumped trees compound this.
The overlap correction assumes random crown placement; evenly spaced plantings overlap less than random, so their true cover sits closer to the gross row, while clumpy natural stands sit closer to the corrected one. Small plots with few trees produce lumpy numbers: one 30-ft crown in a 1/20-acre plot swings cover by 30 points. And cover says nothing about canopy condition: a 60 % cover of dead-topped elms shades and transpires nothing like 60 % of healthy oak.
Forestry note from Dr. Dinesh A. Nagegowda, PhD: Measuring forest canopy cover is essential for evaluating light penetration to the understory, watershed hydrology, and wildlife habitat structure. In our forestry fieldwork, using a spherical densiometer requires taking four orthogonal readings at each sample point and averaging them to account for solar angle bias and uneven crown spread.
Measure solar light extinction beneath dense tree canopies using our understory daily light integral calculator.
Sources
- FAO forest definition: ten percent crown cover threshold (used for: the forest line quoted against gross crown cover)
- American Forests, Tree Measuring Guidelines (used for: crown spread measured along the drip line in two directions)
- Oregon State Extension EM 9058, Measuring Your Trees (used for: crown measurement practice on plots and in street inventories)
Cite This Calculator
For laboratory course reports, academic papers, or institutional protocols (APA format):
Tree Canopy Cover: frequently asked questions
What is tree canopy cover?
The percentage of ground area covered by the vertical projection of tree crowns. Measure crown spreads, convert to crown areas, and divide the sum by the plot area: this tool does exactly that, then corrects for overlap.
Why is corrected cover lower than gross cover?
Gross cover double-counts ground under overlapping crowns; the correction collapses stacked layers to single-covered ground using a random-placement (Poisson) model. Both are legitimate: gross for footprint and the FAO forest line, corrected for light, shade, and microclimate.
How much canopy cover is enough?
It depends on the goal: FAO calls 10 % or more forest, urban shade and cooling programs are commonly judged against roughly a third of a neighbourhood under canopy, and closed timber stands run far higher. Set the target for your purpose, then measure against it with this tool.
How do I measure crown spread?
Find the drip line (the outer edge of the shadow the crown casts) and measure the width across it in two perpendicular directions, from below where possible. Enter the mean as spread, or both readings in ellipse mode for lopsided crowns.
Found a number that does not match its source? Report a mistake. Corrections are published in place and the page date is updated.
Found a number on this page that doesn’t match its source? Email the correction →.

Dr. Dinesh A. Nagegowda, PhD: Plant & Molecular Biology Editor
Dinesh is a plant molecular biologist and Chief Scientist at CSIR-CIMAP whose research runs through functional genomics, transcriptomics, metabolomics, and biosynthetic pathways in plants. He writes and…