Free Lab & Molecular Biology tool
 Free Lab & Molecular Biology tool
Log Reduction Calculator
The Log Reduction Calculator converts colony forming unit (CFU) counts before and after disinfection into decimal log reduction factors and percent kill efficiency. A '4-log reduction' and a '99.99% reduction' are the same claim in two dialects, and knowing both is the difference between reading a disinfection label and being confused by one. Enter before and after counts (or jump straight to a log value) and this calculator gives the log reduction, percent reduction, survivor fraction and fold change together, with the EPA-style definitions the water and hygiene literature uses.
Log Reduction Calculator: result
At a glance
- What it does: Turns before-and-after counts or a stated log value into percent reduction, survivors and fold change.
- Who it is for: Written for reading disinfection labels, water-treatment reports and efficacy claims without guesswork.
- Typical result: The default 10⁶ to 10² returns 4.00 log, 99.99% and one survivor in ten thousand.
How to use the log reduction calculator
- Collect matched before (N₀) and after (N) counts from the same surface, water sample or culture: same units, same assay, same dilution scheme. prefill →
- If you already know the log value from a report or label, switch input style to 'Log reduction directly' and skip the counts. prefill →
- Read log reduction first, then percent. The log value is the one that scales honestly across the 90–99.999% range.
- Check the survivor fraction against your detection limit: if the calculator says no survivors, report LR as '≥ detection limit' the way EPA methods do.
- Negative log reduction means growth: treat it as a failed or inhibitory condition, not a rounding problem.
Log Reduction: the formula & its source
Log reduction is the base-10 logarithm of the ratio of starting to surviving count:
LR = log₁₀(N₀ ÷ N)
Percent reduction and fold reduction are the same ratio restated:
% reduction = (1 − 10−LR) × 100, fold = 10LR
So 2-log = 99% = 100-fold, 3-log = 99.9% = 1,000-fold, 4-log = 99.99% = 10,000-fold. The definitions match the US EPA's Disinfection Profiling and Benchmarking guidance, where treatment performance is expressed in log inactivation of target organisms, and the same log-vs-percent mapping used in standardized efficacy protocols (e.g., CBE KSA-SM-07 for surface disinfectant testing).
| Symbol | Meaning | Unit | Typical range |
|---|---|---|---|
N₀ | count before treatment | CFU or organisms | same units as the after count |
N | count after treatment | CFU or organisms | 0 allowed for complete kill |
LR | base-10 log of the before-to-after ratio | log | −10 to 10 |
% removed | share of the population taken out | % | 90% with every log step |
survivors | fraction still alive | unitless | 10 raised to −LR |
fold | how far the population was divided | × | 10 raised to LR |
Log Reduction: worked example
Worked example: 10⁶ down to 10² organisms. LR = log₁₀(10⁶ ÷ 10²) = log₁₀(10⁴) = 4.00 log. Percent = (1 − 10⁻⁴) × 100 = 99.99%. Survivors = 10⁻⁴ = 1 in 10,000 organisms (0.01%). Fold reduction = 10⁴ = 10,000×. Cross-check the labels: EPA reports this as 4-log inactivation; a package claiming '99.99%' is claiming the same thing.
Example B: a stated claim, and below-detection results
Direct log input, and the zero-survivor case. Switch input style to log reduction and enter 3: you get 99.9% removed, a survivor fraction of 1.00 × 10⁻³ (one organism in a thousand), and a fold reduction of 1,000×, no counts needed. Stay in counts mode with 10⁶ starting and 0 recovered, though, and the calculator refuses to print an infinite kill: it reports a detection-limit floor of ≥ 6.0 log, because nothing grew at the dilution plated. Three logs of detection cannot certify a six-log claim.
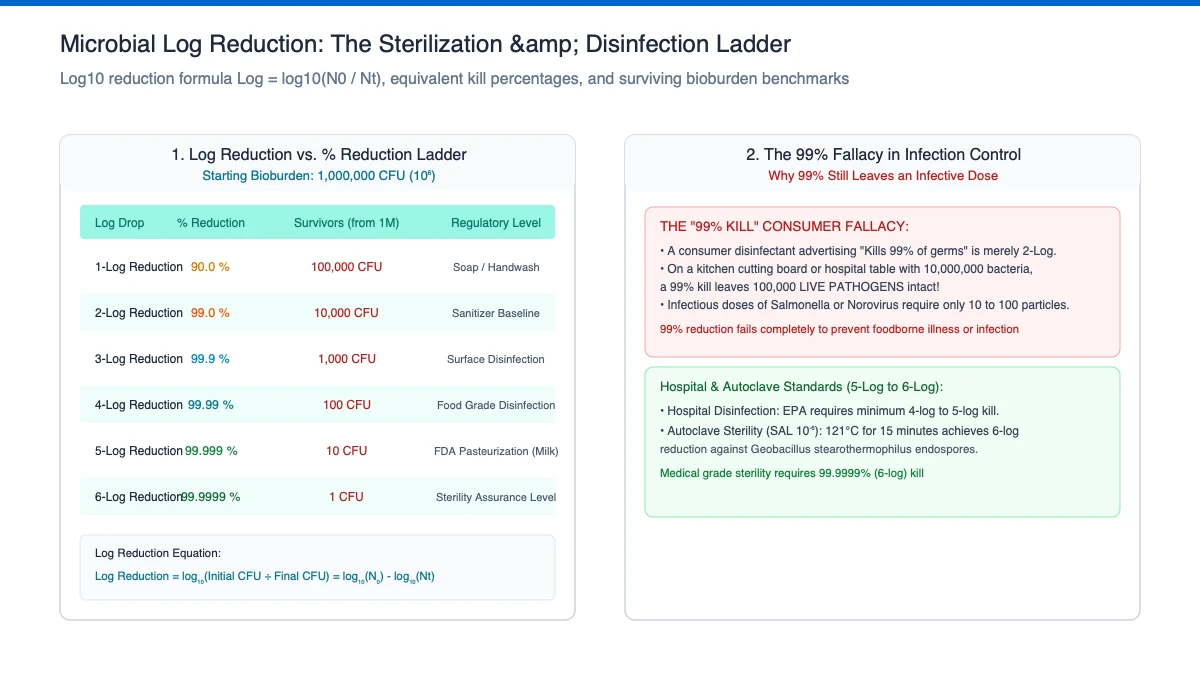
One ratio in three dialects
Log reduction is the base-10 logarithm of starting count divided by surviving count, and every other phrasing is the same ratio restated. Percent reduction is (1 − 10⁻ᴸᴿ) × 100, fold reduction is 10ᴸᴿ, and the survivor fraction is 10⁻ᴸᴿ. Enter one form and the calculator returns the other three together, so a report quoted in logs and a package quoted in percent can be shown to be saying the same thing: 2 log is 99%, 3 log is 99.9%, 4 log is 99.99%, and each whole step removes another ninety percent of whatever survived the last one.
Working in both directions is the practical payoff. A water-treatment report stating 4-log inactivation and a disinfectant bottle claiming 99.99% describe one number, and so do a laboratory target of 5 log and the 99.999% a colleague wrote in a methods paragraph. Being able to move between them prevents the quiet failure where a team believes it achieved a stronger kill than the figure on the page actually supports.
Run the conversions the other way and the same calculator answers a design question: to demonstrate 5-log removal you need an influent count high enough that five decades of survivors still leave something plateable, which sets the starting inoculum before the experiment begins.
Why percentages stop working past ninety
Percent reduction saturates as the population falls, so the numbers crowd together exactly where the decisions get made. The visual gap between 99.9% and 99.99% is a rounding artifact, yet the survivors differ tenfold, and that factor is the entire regulatory conversation for drinking-water treatment and hospital disinfection claims. Logarithms keep the spacing honest: each unit of LR is one more decade removed, no matter how far down the count has already gone.
Percentages still belong in consumer-facing claims, which is why the calculator prints both. Pair the log with the survivor fraction to keep the absolute picture in view: a 5-log reduction on a surface seeded with 10⁸ organisms still leaves 10³ behind, enough to regrow if the surface is recontaminated or the residual decays. Logs describe the ratio, never the residue.
Keeping both formats in the record also makes later comparison possible: a follow-up test can be scored against the original claim in whichever unit the protocol uses, without anyone converting by hand and drifting a decimal place in the process.
Detection limits, censored data and honest reporting
A plate that grows nothing has proved that no colony formed at the dilution tested, not that the population is gone. The honest statement is a floor: reduction is at least the detection limit, written ≥ the log the assay could see. A test sensitive to 3 logs cannot demonstrate a 6-log kill however clean the plates look, and reporting the gap as certainty is how inflated claims enter the literature. Enter a zero survivor count here and the calculator behaves accordingly, returning the detection-limit floor rather than an unbounded number.
The floor rises with your starting count and falls with the smallest dilution you plated, so recording both belongs with the result. Censored values also need care in comparison: two treatments both reported at their detection limit are not known to be equal, only to have both passed it. Mixing plating counts with MPN or ATP readings has the same effect in a different disguise, since each method carries its own counting statistics and none converts cleanly into another.
Small numbers, growth, and the base of the logarithm
Log reduction is unstable when the starting count is small: one organism surviving out of ten is 1-log by arithmetic and almost meaningless statistically, because the count itself swings on a single colony. Work with starting populations large enough that the ratio survives counting error, and treat results from tiny inocula as indicative rather than quantitative.
A negative result is information too. When the after count exceeds the before count the population grew during the test, so no reduction happened: the calculator reports that trend instead of a number, and the finding belongs in the record as a failed or inhibitory condition. Finally, mind the base: disinfection and water treatment standardize on log₁₀, while growth-rate work uses natural logs for μ. Converting without saying which base you used changes every reported value.
Units belong in that conversation as well. CFU, organisms and turbidity-derived counts are not interchangeable even when the ratio looks similar, and stating which one produced the log is what lets a colleague reproduce the number.
What your log reduction result means
Logs are the only scale that stays readable across the range that matters. Percent reduction saturates: the visual gap between 99.9% and 99.99% is tiny but it is a ten-fold difference in survivors, which is the entire regulatory conversation for drinking-water treatment and hospital disinfection claims.
Reading survivor fraction alongside LR keeps the operational reality visible: a 5-log kill on a surface seeded with 10⁸ organisms still leaves 10³ behind, enough to recolonize if the surface is recontaminated or the residual decays.
How to read the output:| Result range | What it means | What to do next |
|---|---|---|
| 1–2 log | routine cleaning range | percent still reads clearly: 90–99% |
| 3–5 log | disinfection and treatment claims | quote the log; percent crowds at the top |
| No survivors detected | below the assay's floor | report LR ≥ the detection limit |
| Negative log reduction | the count rose | treatment failed or was inhibitory |
| Fold reduction | survivors divided out | 1,000× means one in a thousand remains |
Common mistakes with the log reduction
- Reporting an infinite kill because the plate came back empty: State the reduction as at least the detection limit; zero colonies proves nothing grew at the dilution tested.
- Comparing plating counts against ATP or MPN readings: Keep one counting method on both sides, since each assay has its own statistics and none converts into another.
- Quoting 99.999% from a test that only resolved four logs: Match the decimal places to what the assay could see, and quote the log value alongside the percentage.
- Treating a negative log reduction as a rounding problem: Read it as growth: the population increased during the test, so report that instead of forcing a positive value.
Limits of the log reduction calculator
LR values below the assay's detection limit are censored data, not measurements: 'no growth' supports 'LR ≥ x', never 'LR = 12'. Log arithmetic assumes counts from the same dilution method; mixing plating with MPN or ATP readings mixes incompatible counting statistics. Small starting counts make LR unstable: one organism surviving out of ten is 1-log by arithmetic and almost meaningless statistically. Negative values mean growth: report them as such rather than taking logs of anything less than 1.
Laboratory note from Dr. Dinesh A. Nagegowda, PhD: In antimicrobial efficacy testing and disinfection validation, translating percentage reduction into log reduction highlights the non-linear nature of microbial kill curves. A 99% reduction corresponds to a 2-log reduction, leaving 10,000 viable bacterial colony-forming units (CFU) from an initial inoculum of 10^6. In our sterilization assays, achieving a true 6-log reduction (99.9999% kill) is the validated industry threshold to ensure total elimination of resistant bacterial endospores.
Sources
- US EPA, Disinfection Profiling and Benchmarking guidance (used for: log inactivation defined as the base-10 logarithm of influent divided by effluent counts)
- US EPA, Surface Water Treatment Rules plain-English guide (used for: how log-removal requirements are stated and interpreted for drinking-water treatment)
- US FDA, BAM Chapter 3: Aerobic Plate Count (used for: plate-count conventions behind before-and-after numbers, including what an empty plate does and does not prove)
Cite This Calculator
For laboratory course reports, academic papers, or institutional protocols (APA format):
Log Reduction: frequently asked questions
What is the difference between log reduction and percent reduction?
They encode the same ratio; log reduction is logarithmic and percent is linear. 3-log = 99.9% and 4-log = 99.99%. Once past 99%, percentages compress and become easy to misquote, so standards bodies quote logs.
What does a 5-log reduction actually leave behind?
One survivor in 100,000 of the starting population. Applied to a heavily contaminated surface that can still be a substantial absolute number. Logs describe the ratio, not the residue.
Why do some sources use log₁₀ and others natural log?
Disinfection and water treatment standardize on log₁₀ (base-10), which is what 'log reduction' means by convention. Growth-rate work uses ln for μ. Mixing the bases without converting changes every reported value.
My calculation returned a negative log reduction. Why?
The final count exceeded the starting count: the population grew during the test, so there was no reduction to log. Check the counts, then report the growth; do not force it into a positive LR.
Found a number that does not match its source? Report a mistake. Corrections are published in place and the page date is updated.
Something on this page not matching its cited source? Report it.

Dr. Dinesh A. Nagegowda, PhD: Plant & Molecular Biology Editor
Dinesh is a plant molecular biologist and Chief Scientist at CSIR-CIMAP whose research runs through functional genomics, transcriptomics, metabolomics, and biosynthetic pathways in plants. He writes and…