Free Lab & Molecular Biology tool
 Free Lab & Molecular Biology tool
Generation Time Calculator
The Generation Time Calculator determines bacterial generation time and population doubling cycles ($n$) from starting and ending cell titers during logarithmic growth. Generation time g is the microbiology name for how long one doubling takes, the single number that lets you compare strains, media and temperatures. Enter the counts from two points on the log phase and the incubation time, and this calculator returns the number of generations, g in hours or minutes, and the growth constant k, with the classic 3.32 × log formula shown step by step.
Generation Time Calculator: result
At a glance
- What it does: Reports generations, generation time g and growth constant k from two plate counts and an interval.
- Who it is for: The microbiology spelling of the doubling-time calculation, written out with the classic 3.32 formula.
- Typical result: Defaults give 8.32 generations in 4 h: g of 0.48 h, about 28.8 minutes, at k of 2.08.
How to use the generation time calculator
- Plate or count the culture at inoculation (N₀) and again after a known incubation interval (Nₜ): both readings must come from log phase on a semilog growth curve. prefill →
- Keep units identical between readings: CFU/mL against CFU/mL, no mixing with OD600 or cells/mL from a different method. prefill →
- Enter incubation time in the unit you think in (hours or minutes), and the calculator normalizes internally.
- Read n (generations), g and k; cross-check g against the known range for your organism (E. coli ~20 min at 37 °C in rich medium, slower in minimal or at room temperature).
- If g looks implausible, suspect stationary-phase endpoints or dilution arithmetic before doubting the formula: CFU/mL errors compound through every dilution step.
Generation Time: the formula & its source
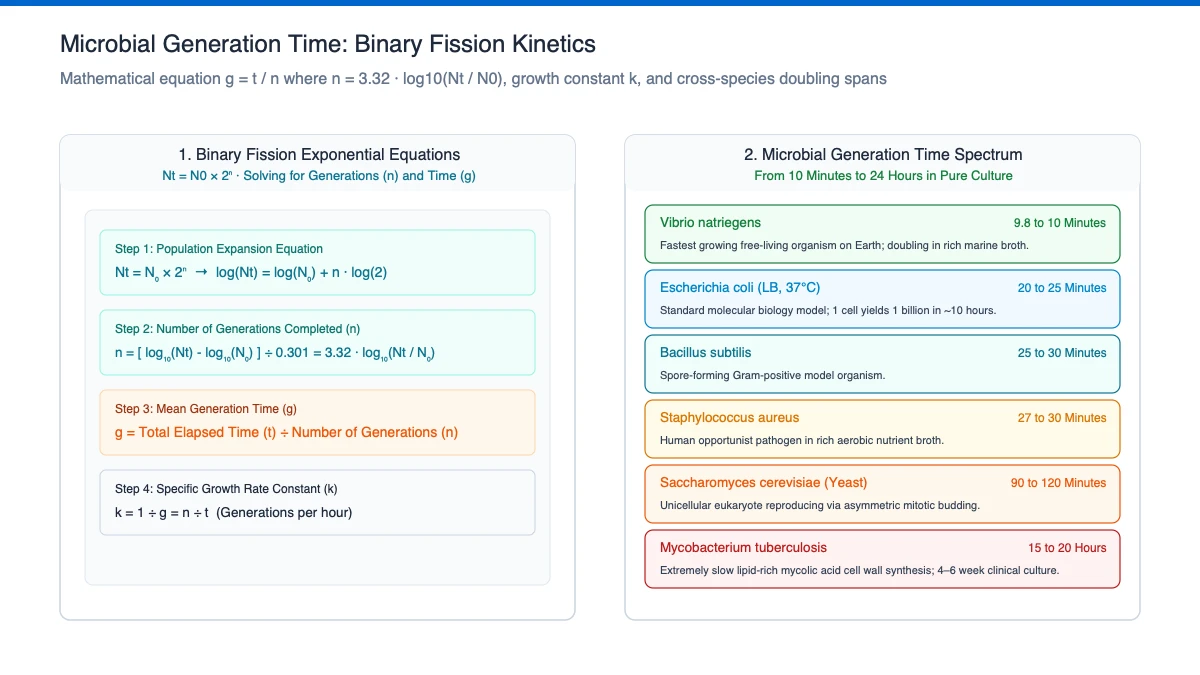
Each generation doubles the population, so Nₜ = N₀ × 2ⁿ and solving for n in base-10 logs:
n = 3.32 × (log₁₀Nₜ − log₁₀N₀)
g = t ÷ n · k = n ÷ t = 1 ÷ g
where t is incubation time, g the generation time (time per doubling) and k the growth constant (generations per unit time). The 3.32 factor is log₁₀(2): converting a log₁₀ ratio into doublings. The relation to specific growth rate is g = ln2 ÷ μ ≈ 0.693 ÷ μ, so the generation-time and doubling-time calculations are the same arithmetic wearing different names.
When estimating initial population sizes ($N_0$) and final harvest densities ($N_t$) from spectrophotometer readings, convert optical density via our OD600 to cell count calculator.
| Symbol | Meaning | Unit | Typical range |
|---|---|---|---|
N₀ | starting viable count | CFU/mL | from the inoculation plate |
Nₜ | final viable count | CFU/mL | identical units to N₀ |
t | incubation interval | h or min | normalized internally either way |
n | generations elapsed | generations | 3.32 × (log₁₀Nₜ − log₁₀N₀) |
g | time per generation | h, with minutes in the note | t ÷ n |
k | growth constant | generations/h | 1 ÷ g |
Generation Time: worked example
Worked example: 1 × 10⁵ to 3.2 × 10⁷ CFU/mL in 4 h. Ratio = 320, so log₁₀(320) = 2.505 and n = 3.32 × 2.505 ≈ 8.32 generations. g = 4 ÷ 8.32 = 0.48 h ≈ 28.8 min per generation. k = 8.32 ÷ 4 = 2.08 generations/h. μ = ln(320) ÷ 4 = 5.768 ÷ 4 = 1.442 h⁻¹. Check: 0.693 ÷ 0.48 ≈ 1.44. A 29-minute generation time fits a culture growing well but not at full rich-medium speed.
Example B: minutes input, and what the guards catch
Minutes mode, and the two guards. Enter the same pair with the unit selector on minutes and the interval typed as 240: the calculator divides it down internally and returns n = 8.32, g = 0.48 h (28.8 minutes) and k = 2.08 generations/h, identical to the hours run, because only the ratio of interval to generations matters. Now flatten the pair: Nₜ equal to N₀ returns no generation time at all, flagged as stationary, and a pair where the count fell returns a decline note pointing you at a D-value instead. Growth constants describe division, so the guards fire whenever division is not what the data shows.
Where the 3.32 comes from
Each generation doubles the population, so Nₜ = N₀ × 2ⁿ, and solving in base-10 logarithms turns the ratio into generations with a single constant: n = 3.32 × (log₁₀Nₜ − log₁₀N₀). That 3.32 is log₁₀(2), the factor that translates a decade-based ratio into doublings. From there the rest is division: g = t ÷ n gives time per generation, and k = n ÷ t = 1 ÷ g gives generations per unit time, the two reciprocal ways of saying how fast the culture is moving.
Work the defaults to see it land. The count rises from 1 × 10⁵ to 3.2 × 10⁷ CFU/mL, a ratio of 320, whose base-10 logarithm is 2.505; multiply by 3.32 and you have 8.32 generations. Divide the 4-hour interval by that and g comes out at 0.48 h (28.8 minutes per generation), while k returns 2.08 generations per hour. The two numbers always multiply to one, so quoting either tells a colleague the same story.
Generation time, doubling time and μ are one quantity
The three names differ by discipline rather than by meaning. Microbiology grew up with generation time g because it plated cultures and timed them; cell culture inherited doubling time for the same interval; growth physiology prefers μ, the natural-log slope, because it composes cleanly in rate equations. Convert between them with ln2 ≈ 0.693: g = ln2 ÷ μ, and the same 0.48 h generation time becomes a μ of 1.44 h⁻¹ on the doubling-time page.
That equivalence is useful when a number arrives from an outside source. A doubling time quoted in a paper, a growth constant from a fermentation report and a specific growth rate in a model all describe one rate, and converting instead of re-measuring saves an experiment. It also sets a consistency check: if the pages here disagree on the same counts, one of the inputs was entered differently rather than the arithmetic differing.
The equivalence also explains why two labs quoting the same culture in different vocabularies still agree: converting g to μ or to doubling time changes units, never the underlying division rate, and any disagreement after conversion points at the inputs.
Timepoints the arithmetic deserves
Both counts must come from the exponential stretch of the semilog plot, because that is the only region where the population divided at a steady rate. Endpoints dragged into lag make generations look scarce and g stretch; endpoints after the inflection compress generations and flatter the culture. A straight line through three or more log-phase points is what tells you the two you used were honest, and the shortcut printed with the result (slope of 0.301 ÷ g per hour) gives you a way to check the answer against the plot you already have.
Plate counting contributes its own arithmetic risk. CFU/mL inherits every dilution step on the way to the plate, so a single missed ten-fold dilution makes the ratio ten times wrong and drags g down with it. Keep the dilution scheme identical between the two samples, count colonies in a scorable range, and treat a generation time that looks biologically absurd as a bookkeeping problem first: the formula is rarely where the fault lies.
Organism and conditions do the real work
Numbers vary enormously and legitimately. Escherichia coli reaches roughly twenty minutes per generation at 37 °C in rich medium, yeast runs near ninety minutes, and the same strain on minimal medium or at room temperature takes several times longer. Temperature, carbon source, aeration and growth phase all move g by factors, which is why a generation time is only quotable beside the conditions it was measured under.
Report the incubation temperature and medium whenever the value leaves your notebook, and expect the calculator's assumption of constant binary fission to break in defined situations: diauxic shifts pause growth while the culture switches carbon sources, filamentous organisms divide without separating, and stressed cells elongate without adding viable units. In those cases the interval average still describes overall biomass progress, but it stops being a clean measure of cell division.
The other way g fails is by looking plausible while describing the wrong organism: contamination by a faster grower pulls the figure down without any arithmetic noticing, which is why a surprising result deserves a microscopy check.
What your generation time result means
Generation time converts a growth curve into a comparison instrument: same organism, two media (g tells you which is richer without reading anything else). It also drives experiment scheduling: number of generations between inoculation and harvest, expected culture volume at a target density, and when a selection pressure has had enough generations to act.
k and μ are the same information in different units. Pick whichever your protocol quotes and stay consistent; mixing per-minute and per-hour growth constants is a classic source of order-of-magnitude confusion.
How to read the output:| Result range | What it means | What to do next |
|---|---|---|
| g near 20–30 min | healthy bacterial growth in rich medium | log phase, conditions good |
| g near 1–2 h | yeast, or a stressed culture | check medium, temperature and aeration |
| k and g disagree as reciprocals | rounding only | k × g should sit at 1.000 |
| n far above what the interval allows | dilution error or stationary endpoint | recheck the plates before reporting |
| Not defined flag | no net growth between counts | report stationary or decline instead |
Common mistakes with the generation time
- Typing the interval in hours while the selector is on minutes: Match the unit to what you typed, or enter 4 for hours and 240 for minutes; the calculator divides minutes down internally.
- Taking the final count after growth slowed into stationary phase: Plate both samples inside the straight-line region of the semilog plot, since blended phases report a generation time the culture never had.
- Letting one dilution step go astray between the two plates: Repeat the same dilution scheme for both timepoints, because a missed tenfold step distorts the ratio and g follows it straight down.
- Publishing g without the incubation temperature: Quote temperature and medium next to the number; identical strains differ several-fold between 37 °C rich medium and minimal medium at room temperature.
Limits of the generation time calculator
Only exponential-phase counts qualify: endpoints that straddle stationary phase will report a g far longer than the organism ever had. CFU/mL counts viable units, so clumping or a plating dilution error skews the ratio directly: an off-by-one dilution step is a 10-fold error in n. Temperatures matter hugely: quote g next to the incubation temperature or the number is not reproducible. This calculator assumes binary fission at a constant rate; diauxic shifts and filamentous growth break that assumption.
Laboratory note from Dr. Dinesh A. Nagegowda, PhD: Calculating generation time (g) from log-phase cell counts requires precise timepoint synchronization. In our microbial research, inoculating fresh media from an overnight stationary-phase culture introduces an extended lag phase as cells synthesize fresh ribosomal machinery and transport enzymes. In our experiments, pre-culturing cells into early exponential phase before starting kinetic measurements yields clean, reproducible generation times matching published physiological models.
Sources
- LibreTexts Microbiology (Bruslind), chapter 9: Microbial Growth (used for: the 3.32 × log₁₀ generation-time formula and the growth constant as taught in the standard text)
- OpenStax Microbiology §9.1 How Microbes Grow (used for: growth-curve phases and the requirement that counts come from exponential growth)
- Pearson, Brock Biology of Microorganisms (used for: typical generation times by organism and how medium and temperature shift them)
- NCI-Frederick Animal Production Program, Cell Density, Viability and Generation Time Determination SOP (used for: counting and viability procedure behind the CFU and cell-density inputs)
Cite This Calculator
For laboratory course reports, academic papers, or institutional protocols (APA format):
Generation Time: frequently asked questions
Is generation time the same as doubling time?
Yes, for a population growing by binary fission they are two names for the same quantity. Generation time (g) is the microbiology convention; doubling time is common in cell culture. Both invert μ the same way.
Why the 3.32 factor in the formula?
It is log₁₀(2): a ratio in base-10 logarithms becomes doublings when multiplied by 3.32. If you take logs in base 2 directly you get n without the factor (same arithmetic, different base).
My g came out negative or undefined. What happened?
The final count was at or below the starting count, so the population was stationary or declining. The calculator flags this instead of returning a meaningless number; check viability and whether the interval crossed into death phase.
How many timepoints do I need?
Two give an answer; three or more in the straight-line region of a semilog plot tell you the answer is trustworthy. Single-pair calculations inherit all the error of both plate counts.
Found a number that does not match its source? Report a mistake. Corrections are published in place and the page date is updated.
Something on this page not matching its cited source? Report it.

Dr. Dinesh A. Nagegowda, PhD: Plant & Molecular Biology Editor
Dinesh is a plant molecular biologist and Chief Scientist at CSIR-CIMAP whose research runs through functional genomics, transcriptomics, metabolomics, and biosynthetic pathways in plants. He writes and…