Free Genetics tool
 Free Genetics tool
Mutation Frequency Calculator
The Mutation Frequency Calculator calculates mutant allele proportions and evolutionary mutation rates per generation from observed colony or sequencing callsets. A mutation rate is only meaningful next to its unit: per base, per gene or per genome per generation are three different numbers for the same experiment. Enter how many mutants you saw out of how many you screened, choose what each screening unit represents, and the calculator converts the raw frequency into all three scales and lines them up against published benchmarks.
Mutation Frequency Calculator: result
Benchmarks: about 0.0033 mutations per genome per replication across DNA microbes (Drake 1991), which is roughly 3 × 10⁻¹⁰ per base pair for a 10⁷ bp genome, and about 1.2 × 10⁻⁸ per base pair per generation in humans (Kong et al. 2012; Jónsson et al. 2017). A single screening experiment almost never lands on the benchmark exactly; what matters is the order of magnitude.
At a glance
- What it does: Converts mutants out of a screened total into rates per base pair, per gene and per genome, with benchmarks alongside.
- Who it is for: For students and bench scientists who have a screen count and need it on the same scale as published rates.
- Typical result: Returns the raw frequency, three unit conversions and a 95% interval so small counts stay honest.
How to use the mutation frequency calculator
- Count the mutants you actually observed and enter them, along with the total number of individuals, colonies or positions screened in the same experiment. prefill →
- Set what one screening unit represents: whole genomes (the usual case when you screen individuals), single base pairs, or one 1,000 bp gene. prefill →
- Pick the organism so the genome-size conversion uses the right denominator. The per-base rate depends entirely on this.
- Read the per-base-pair row as the headline number and compare its benchmark ratios: below 1 means rarer than the reference rate, above 1 more frequent.
- Check the 95% interval before drawing conclusions: with small mutant counts the interval is wide, and a single experiment rarely pins a rate to two significant figures.
Mutation Frequency: the formula & its source
Frequency is the raw ratio, then unit conversion does the rest. Multiply or divide by genome size and gene size to move between scales:
f = mutants ÷ total · rateper bp = f ÷ genome size · rateper genome = f × genome size
Sampling error on a proportion uses the binomial standard error, so an approximate 95% interval is f ± 1.96 × √(f(1 − f) ÷ n). Comparisons against published rates are ratios of the per-base numbers: your rate divided by the benchmark.
| Symbol | Meaning | Unit | Typical range |
|---|---|---|---|
mutants | mutant colonies, individuals or events counted | events | 0 to 1000000 |
total | everything examined in the same experiment | units | 1 to 10000000 |
f | raw frequency, mutants divided by units screened | proportion | 0 to 1 |
genome | genome size used for the per-base conversion | base pairs | 4.64 x 10^6 to 3.2 x 10^9 |
Mutation Frequency: worked example
Worked example: 12 mutants among 10,000 screened (the defaults), whole-genome basis, E. coli. f = 12/10,000 = 1.2 × 10⁻³ per genome. Dividing by the 4.64 × 10⁶ bp genome gives 1.2 × 10⁻³ ÷ 4.64 × 10⁶ = 2.59 × 10⁻¹⁰ per base pair, about 0.86× the classic microbial figure of ~3 × 10⁻¹⁰, the same order of magnitude you would expect. The 95% interval on the raw frequency is roughly 5.2 × 10⁻⁴ to 1.9 × 10⁻³, a useful reminder that twelve events carry real uncertainty.
Example B: a screen with no mutants
Example B: a screen with no mutants. Enter 0 mutants among 10,000 screened. The point estimate reads zero, but the true rate is plainly not zero, and the usual upper bound for a zero-count screen is about 3 divided by the number screened: here 3 × 10^-4 per genome, or roughly 6 × 10^-11 per base pair for E. coli. Report that bound instead of the zero, since a clean screen still leaves the door open to rare events.
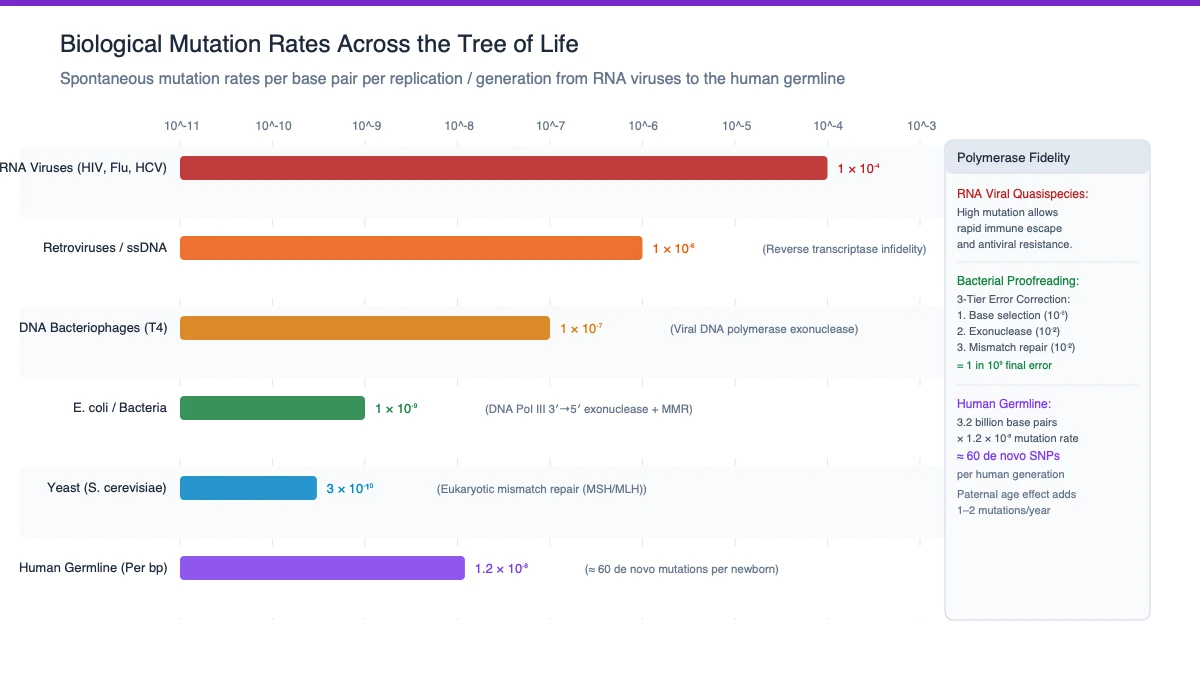
The same count in three units
A mutation number means nothing without the unit attached, and the same experiment can be stated three ways. The raw frequency is mutants over units screened. Divide that by genome size and you get the per-base-pair rate, the scale that lets bacteria, flies and humans be compared on one axis. Multiply by genome size and you have the per-genome figure, which is how a whole-organism burden is usually quoted.
The screening basis decides which conversion applies. If each unit is a whole individual, the per-genome figure comes first and the per-base number follows by division. If each unit is already a base pair, the raw frequency is the per-base rate as it stands. The gene option sits between them, assuming a 1,000 bp gene so the per-gene figure is readable at a glance.
The defaults walk through every unit at once. Twelve mutants among ten thousand screened gives a raw frequency of 1.2 × 10^-3 per genome; dividing by the 4.64 × 10^6 bp E. coli genome lands on 2.59 × 10^-10 per base pair, close to the classic microbial figure of about 3 × 10^-10. Setting the basis to base pair skips the first step entirely, and setting it to gene assumes a 1,000 bp stretch. The 95% interval on the raw frequency runs from about 5.2 × 10^-4 to 1.9 × 10^-3, a reminder that twelve events leave real uncertainty.
Moving between per-base and per-genome
Genome size is the denominator that makes comparisons possible. The classic microbial figure sits near 0.0033 mutations per genome per replication, which sounds enormous until it is spread across millions of base pairs and becomes roughly one change per billion per generation at any given position. The same happens in reverse for a human genome: a per-base rate that looks tiny becomes a substantial number of new variants per child.
The genome selector supplies the sizes for the four organisms the page knows, and picking the wrong one distorts every per-base figure that follows. That is also why organism comparisons must be normalised to base pairs rather than genomes: a 4.64 million bp bacterial genome and a 3.2 billion bp human genome differ by about seven hundred-fold, which swamps any real biological difference in rate.
How wide the interval really is
Sampling error on a proportion follows the binomial standard error, so the page reports the frequency with a 95% interval of about f plus or minus 1.96 times the square root of f(1-f)/n. With twelve mutants among ten thousand screened, the interval already spans nearly a factor of four, which is a useful reminder that a single experiment rarely pins a rate to two significant figures.
Rules of thumb start at around twenty to thirty events before the interval narrows to roughly a factor of two. Zero counts break the normal-theory interval entirely, since it would return a zero-width interval for a rate that is obviously not zero; the standard fix is the rule of three, an upper bound of about 3 divided by the number screened. Always report the interval alongside the point estimate.
Comparing with published benchmarks
Benchmarks are ratios of per-base numbers: your rate divided by the reference rate, with 1.0 meaning the same order of magnitude. The default screen lands near 0.86 times the classic microbial figure, comfortably inside the range you would expect from one experiment. The germline figures on the list come from pedigree sequencing and represent a different measurement, so treat the comparison as an order-of-magnitude check rather than a verdict on your bench work.
An elevated ratio is a prompt, not a conclusion. Mutator strains, repair-defect mutants and mutagen exposure all raise rates, and that is exactly what these screens are built to detect, but the unit conversion and the screening sensitivity are checked first. Screening also sees only what it can detect: forward assays miss silent changes, and definitions of mutant vary between experiments, so two protocols rarely produce directly comparable numbers.
Benchmark ratios are worth reading in both directions. Below 1 the screen came out rarer than the reference, which is unremarkable for a single experiment; above 1 something changed, and the checklist before any biological story is the unit conversion, the organism chosen and what the assay could actually detect. Rates from fluctuation tests count mutations per cell per generation, while pedigree sequencing counts changes per generation per site, so the two belong on separate lines of any comparison.
What your mutation frequency result means
Mutation rates are quoted per base per generation precisely because genomes differ in size: 0.0033 per genome sounds enormous until you divide it across millions of base pairs and it becomes one change per billion per generation at any given position.
The per-gene conversion is the clinically readable version (a rate of 2.6 × 10⁻⁷ per 1,000 bp gene says how often a screen of that gene should turn something up), while the per-base number is what lets you compare bacteria, flies and humans on one axis.
How to read the output:| Result range | What it means | What to do next |
|---|---|---|
| Per bp, below benchmark | rarer than the reference rate | Normal for a single clean screen |
| Per bp, above benchmark | more frequent than the reference | Check units and sensitivity before concluding |
| Wide 95% interval | few events counted | Report the range instead of the point value |
| Zero mutants | point estimate reads zero | Quote the rule-of-three upper bound instead |
Quantify deviations from expected genotypic equilibria caused by mutational pressure on our Hardy-Weinberg population equilibrium tool.
Common mistakes with the mutation frequency
- Reporting the raw frequency as though it were a per-base rate: Attach the unit: divide by genome size for per-base, or keep it per genome when each unit was an individual.
- Keeping the default genome size for a different organism: Select the organism you actually screened, because the per-base figure scales directly with that denominator.
- Quoting a point estimate from fewer than ten events: Include the 95% interval, which will show the estimate spanning a wide range at those counts.
- Comparing a fluctuation-test rate with a pedigree-sequencing rate: The two measure related but different things, so compare like with like before calling a rate high or low.
Limits of the mutation frequency calculator
Screening detects what it can see: forward-mutation assays miss silent changes, assays differ in sensitivity between loci, and 'mutant' definitions vary between experiments. Rates from fluctuation tests (per cell per generation) and rates from pedigree sequencing (per generation per site) are measuring related but not identical things.
The normal-approximation interval behaves badly for very small counts: zero mutants gives a zero-width interval even though the true rate is plainly not zero (use the rule of three, 3/n, for upper bounds). Genome sizes are rounded, gene length is assumed at 1,000 bp, and mutation-rate variation across a genome is itself several-fold.
Research note from Dr. Dinesh A. Nagegowda, PhD: In mutagenic screen assays and microbial genetics, calculating mutation frequency (mutants per total viable cells) must be distinguished from the true mutation rate (mutations per cell division). In our chemical mutagenesis trials, fluctuating selection efficiency and "jackpot" mutations occurring early during culture growth (the Luria-Delbrück fluctuation phenomenon) can artificially inflate observed mutation frequencies.
Map nucleotide transversion and transition mutations to altered mRNA sequences with our genetic code transcription tool.
Sources
- Drake, J.W. (1991), a constant rate of spontaneous mutation in DNA-based microbes, PNAS 88:7160-7164 (used for: the microbial benchmark rate near 0.0033 per genome per replication)
- Kong, A. et al. (2012), rate of de novo mutations and the origin of genetic disease, Nature 488:471-475 (used for: human germline mutation rates used as the pedigree benchmark)
- Jonsson, H. et al. (2017), parent-of-origin de novo mutations in humans, Nature 549:519-522 (used for: per-generation human mutation rate estimates for comparison)
Cite This Calculator
For laboratory course reports, academic papers, or institutional protocols (APA format):
Mutation Frequency: frequently asked questions
What is the difference between mutation frequency and mutation rate?
Frequency is what you observed: mutants divided by units screened in one experiment. Rate implies a time or generation component: mutations per base pair per replication or per generation. The calculator shows the frequency first, then the per-generation-style conversions.
Why does genome size matter so much?
It is the denominator. The same per-genome frequency spread across a 4.6 million bp bacterial genome and a 3.2 billion bp human genome differs seven hundred-fold per base pair, which is why organism comparisons must normalise to base pairs.
How many mutants do I need for a decent estimate?
Rules of thumb start around 20–30 events before the confidence interval narrows to roughly a factor of two. With 12 mutants the interval already spans almost 4×, so report it rather than the point estimate.
Is a rate above the benchmark alarming?
Not automatically. Elevated rates can reflect a mutator strain, DNA-repair defects or mutagen exposure (that is exactly what these screens are designed to detect), but first check the unit conversion and the screening sensitivity before concluding biology.
Found a number that does not match its source? Report a mistake. Corrections are published in place and the page date is updated.
Something on this page not matching its cited source? Report it.

Dr. Dinesh A. Nagegowda, PhD: Plant & Molecular Biology Editor
Dinesh is a plant molecular biologist and Chief Scientist at CSIR-CIMAP whose research runs through functional genomics, transcriptomics, metabolomics, and biosynthetic pathways in plants. He writes and…